
In the face of extreme weather, rising energy demand, and ambitious clean energy goals, the U.S. electric grid is under pressure like never before. This report offers a data-driven look at how each state—and California’s utility providers—are performing when it comes to grid reliability, residential electricity prices, and solar energy adoption.
Scorecard Overview
Drawing from 2023–2025 data from the U.S. Energy Information Administration (EIA) and the Solar Energy Industries Association (SEIA), we analyze which regions are delivering consistent power at a fair price—and which are falling behind.
We pay particular attention to California, Arizona, and Nevada —three Western states leading the country’s energy transition. Among the standout insights:
- California has reclaimed the top spot in solar capacity but still struggles with reliability, especially in PG&E’s service area.
- California experiences the 4th highest electricity prices in the country, more than 2x the price per kilowatt hour of Florida or Texas.
- Nevada is the only state with both high solar use and falling electricity prices.
- Maine and Tennessee are experiencing some of the longest outages in the country.
- Washington, D.C. ranks as the most reliable grid—but also had the steepest price increase.
The findings illustrate how uneven the U.S. energy experience has become—where solar growth, grid quality, and affordability are diverging in surprising ways.
Summary of Key Findings
California Highlights
- Has the 4th highest electricity price in the nation (31.66¢/kWh as of Feb. 2025), impacting over 15 million customers. This is more than 2x the prices for the similarly sized states of Florida and Texas.
- Leads the U.S. in solar generation, producing 30.1% of its electricity from solar.
- Regained the #1 spot in total installed solar capacity (50,640 Megawatts), nudging Texas back to the #2 position with its 41,460 Megawatt capacity.
- Ranks moderate to poor in reliability, with 5.88 hours of average downtime and 2.22 outages per customer in 2023 (the latest year for which data is available), despite top 5 prices at 31.66c per kilowatt hours, presenting a double burden to residents.
- There is a significant disparity in reliability between utility companies, with some of the largest service areas suffering the most. Pacific Gas & Electric, the state’s largest utility serving over 5M customers, reported the second highest cumulative outage hours in California in 2023 (11.9 hours).
- PacificCorp. serves 46,669 residents, sits in worst position for most downtime with more than triple the cumulative outage hours of Pacific Gas & Electric: 39.7 per average resident.
- Several areas’ utility companies impressed with their very small number of outage hours – amounting to mere minutes for the entire year:
- Alameda Municipal Power ranked # 2 with only 0.1 hours of downtime per average resident
- City of Burbank Water and Power ranked 4th best with only 0.2 hours of downtime per average resident
- City of Roseville ranked #5 with only .3 hours of downtime per average resident
- City of Pas
Arizona Highlights
- Ranked 4th in total installed solar capacity with 9,465 MW and generates 11.2% of its electricity from solar.
- This represents an increase in nationwide ranking of solar capacity from #6 in 2024 to #4 today.
- The stability of Arizona’s electricity supply beats the national average with only 1.7 cumulative hours of downtime in 2023 versus a national average of 6.2 hours.
- Despite solar leadership, Arizona still experienced a 5.6% increase in electricity prices in 2024, the 10th highest increase nationwide.
Nevada Highlights
- Has the second-highest solar share of any state at 27.7% of total electricity, and its 7,784 megawatt capacity increased its national ranking in total installed solar capacity from #11 in 2024 to #6 today.
- Experienced the biggest year-over-year price drop in the U.S. at -13.97%.
- Reliability is improving but remains mixed, with 2.31 hours of average downtime per customer.
Nationwide Highlights
Highest Electricity Prices (Feb. 2025).
- Hawaii remains the most expensive state for electricity at 42.7¢ per kWh.
- New England states like Connecticut (33.3¢), Rhode Island (33.1¢), and Massachusetts (30.4¢) follow closely.
- California ranks #4 at 31.66¢ per kWh, impacting more than 15 million customers—twice the cost seen in the other large states of Texas and Florida.
Largest Decreases in Electricity Pricing
- Nevada experienced the largest year-over-year drop in electricity rates, with a 13.97% decrease.
- Other states like North Carolina (-4.91%), North Dakota (-3.04%), and Hawaii (-2.82%) also saw meaningful reductions.
Largest Increases in Electricity Pricing
- Washington, D.C. had the steepest price hike in the country at 15.04%, followed by Utah (+13.33%) and Connecticut (+12.64%).
- Seven of the ten biggest increases occurred in Northeastern states.
Least Reliable Electricity
- Maine and Tennessee experienced the least reliable electricity in 2023.
- Maine ranked #2 in outage frequency with 3.31 outages per resident and #1 in total downtime at 31.05 hours.
- Tennessee followed closely, ranking #4 in both frequency (2.8 outages) and downtime (15.45 hours).
Most Reliable Electricity
- Washington, D.C. and Nebraska topped the list for most reliable electricity.
- D.C. residents averaged only 0.37 outages in 2023, with just 1.2 hours of downtime. However, D.C. experienced the highest increase in pricing nationwide, more than 15% increase in price per kilowatt hour year over year.
- Nebraska had the second-fewest outages (0.56) and the lowest total downtime at only 1.16 hours.
Solar Power Share by State
- California generates 30.1% of its power from solar, followed closely by Nevada (27.7%) and Massachusetts (24.6%).
- Despite high solar potential, Southern and Southeastern states lag behind in adoption, with many generating less than 5% of their electricity from solar.
Southwest Solar Surge
- Five Southwestern states are now in the top 15 for total installed solar capacity.
- California reclaimed the #1 spot in 2025, surpassing Texas.
- Arizona rose from #6 to #4 and Nevada from #11 to #6.
- Despite being generally sunny, the South and Southeast states mostly rank behind the national average for the percentage of power they generate from solar.
Where is Electricity the Most Expensive?

Drawing from 2023–2025 data from the U.S. Energy Information Administration (EIA) and the Solar Energy Industries Association (SEIA), we analyze which regions are delivering consistent power at a fair price—and which are falling behind.
We pay particular attention to California, Arizona, and Nevada —three Western states leading the country’s energy transition. Among the standout insights:
- California has reclaimed the top spot in solar capacity but still struggles with reliability, especially in PG&E’s service area.
- California experiences the 4th highest electricity prices in the country, more than 2x the price per kilowatt hour of Florida or Texas.
- Nevada is the only state with both high solar use and falling electricity prices.
- Maine and Tennessee are experiencing some of the longest outages in the country.
- Washington, D.C. ranks as the most reliable grid—but also had the steepest price increase.
The findings illustrate how uneven the U.S. energy experience has become—where solar growth, grid quality, and affordability are diverging in surprising ways.
Close Up: California’s Best & Worst Utility Providers Ranked
Price vs. Reliability: Two Different Challenges
While high costs are a major concern for California electricity customers, they don’t always correlate with reliability, presenting a “double burden” to millions of consumers. Some of the state’s most expensive utility providers still struggle to deliver consistent service. This makes reliability data a critical counterpart to pricing when evaluating overall utility performance. The following sections highlight how often outages occur and how long they last—two key indicators of service quality.
- California has reclaimed the top spot in solar capacity but still struggles with reliability, especially in PG&E’s service area.
- California experiences the 4th highest electricity prices in the country, more than 2x the price per kilowatt hour of Florida or Texas.
- Nevada is the only state with both high solar use and falling electricity prices.
- Maine and Tennessee are experiencing some of the longest outages in the country.
- Washington, D.C. ranks as the most reliable grid—but also had the steepest price increase.
The findings illustrate how uneven the U.S. energy experience has become—where solar growth, grid quality, and affordability are diverging in surprising ways.
Most and Least Frequent Outages

Most & Least Downtime

California’s utility performance varies significantly by provider.
City-run utilities such as Colton, Alameda, and Roseville delivered strong reliability in 2023—with less than 0.3 hours of downtime per customer.
In contrast, PacifiCorp had the highest downtime at nearly 40 hours per customer.
Pacific Gas & Electric, serving over 5 million Californians, reported 11.9 hours of downtime and 2.22 outages per customer—among the worst in the state.
Overall, customers in California’s municipal utility districts received more consistent service than those served by larger investor-owned utilities.
The 2024–2025 Fire Seasons & Severe Weather Took a Toll
While this report focuses on the latest official outage data from SEIA (2023), it’s important to mention that 2024 and 2025 to date have posed increasing challenges to California’s utility reliability.
California’s electric grid faced significant challenges in 2024 and early 2025 due to extreme weather events. A hotter-than-average summer in 2024 led to widespread wildfires, prompting utilities like PG&E to implement multiple Public Safety Power Shutoffs (PSPS) to mitigate fire risks. Notably, during the Park Fire in July 2024, over 3,000 PG&E customers lost power, with service restored to two-thirds by July 30. (source)
The winter of 2024–2025 brought a series of atmospheric river storms, causing extensive flooding and equipment failures across Central and Southern California. In early February 2024, two atmospheric rivers resulted in damages estimated at approximately $3 billion and nine fatalities. The storms caused record-breaking rainfall, with Bel-Air recording 12.42 inches in 24 hours—a 380-year return interval event. (source)
These back-to-back weather extremes strained California’s aging grid infrastructure, leading to increased outages and downtime, especially among investor-owned utilities serving rural or fire-prone regions. For instance, during the February storms, over 156,000 utility customers in Los Angeles were without power, with service restored to most by nightfall. (source)
Where are Electricity Prices Going Up the Most?
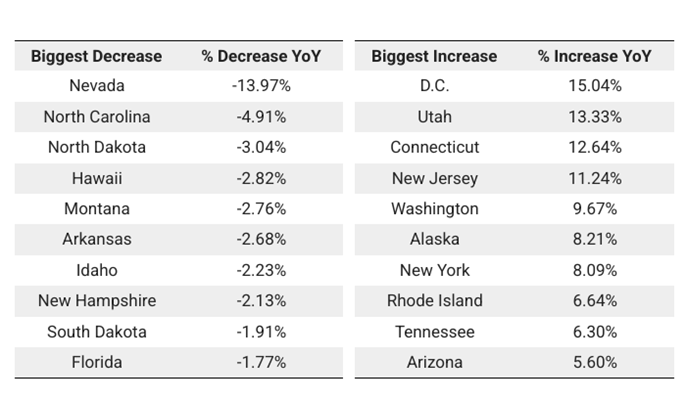
Nationwide, the average residential electricity price rose 3.1% from February 2024 to February 2025.
Washington, D.C. experienced the sharpest year-over-year increase at 15.04%, followed closely by Utah (+13.33%) and Connecticut (+12.64%).
On the other end of the spectrum, Nevada saw a dramatic 13.97% price drop—by far the largest in the country.
North Carolina (-4.91%), North Dakota (-3.04%), and Hawaii (-2.82%) also saw noticeable declines in electricity prices.
Which States Had the Most Frequent Outages?
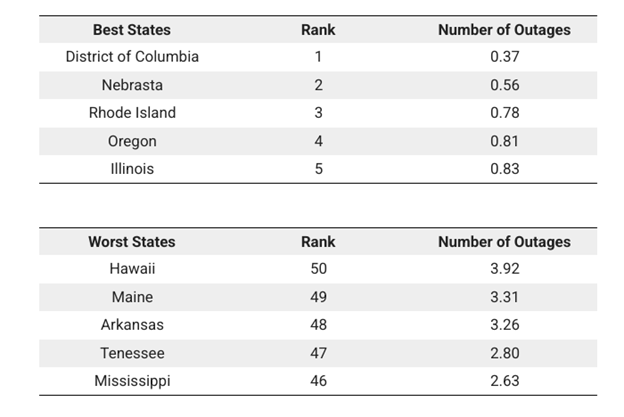
Hawaii, Maine, and Alaska had the most frequent power outages in 2023, with residents experiencing more than three outages per year. Tennessee and Mississippi also ranked among the top five, highlighting persistent reliability issues in parts of the South.
By contrast, Washington, D.C. had the fewest outages—just 0.37 per customer on average—followed by Nebraska, Rhode Island, Oregon, and Illinois, all with fewer than one outage annually.
Which States Had the Most Downtime?
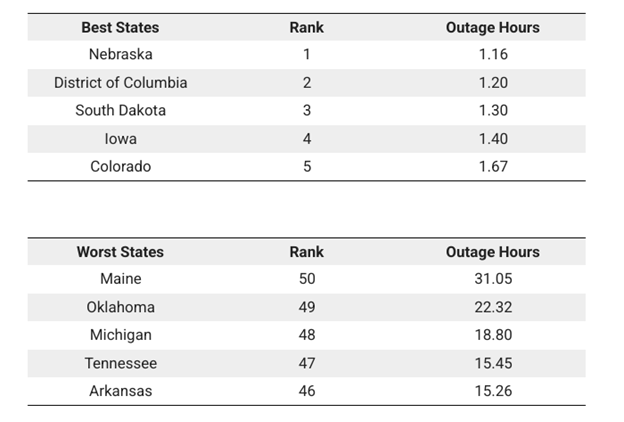
Maine residents endured the most electricity downtime in 2023—over 31 hours without power. Oklahoma, Michigan, Tennessee, and Arkansas also experienced high total outage hours, ranging from 15 to 22 hours.
States with the shortest downtime were clustered in the Midwest and West, with the exception of Washington, D.C. Nebraska led the nation with just 1.16 outage hours in total, followed by D.C. (1.2 hours), South Dakota (1.3), Iowa (1.4), and Colorado (1.67).
Close Up: How Does Solar Adoption Stack Up vs. Electricity Reliability?
Southwestern states like California, Nevada, and Arizona are leading in solar power generation while also maintaining grid reliability above the national average. These states all reported fewer than six outage hours in 2023—better than the 6.2-hour national average.

In contrast, many Southern and Southeastern states, including Oklahoma, Tennessee, and Mississippi, continue to experience high downtime and low solar adoption. Most generate less than 5% of their electricity from solar and exceed the national average in outage hours.

Close Up: Explosive Southwest Solar Adoption in 2024

In Q4 2024, California reclaimed the #1 position for total installed solar capacity, overtaking Texas with more than 50,000 megawatts of capacity.
- Texas overtook California as the top-ranked state for solar capacity additions for the first time in 2021
- In 2022, California was once again the top-ranked solar market
- In 2023, Texas ranked #1, surpassing California for the second time.
Southwestern states Arizona, Nevada and New Mexico also ranked in the top 15 nationally, with Arizona climbing from #6 to #4 and Nevada from #11 to #6.
This shift highlights the Southwest’s expanding leadership in solar energy as infrastructure grows and state incentives continue to accelerate adoption.
Why Is Solar Adoption in California So High?
Mandates and Pro-Solar Policies Drive Growth
California’s solar dominance isn’t just about sunshine and high utility costs—it’s also the result of strong legal and regulatory support.
Solar Mandate for New Homes:
Since 2020, all new low-rise homes in California are required to include solar panels, following a 2018 ruling by the California Energy Commission. The mandate expanded in 2023 to cover most new apartments and commercial buildings.
Supportive Regulations:
- The Solar Rights Act prohibits local restrictions on solar installations.
- AB 2188 ensures streamlined permitting for residential solar.
- Net Energy Metering (NEM) policies allow customers to earn credits for excess power, encouraging both solar and battery storage
(GreenLancer). - Solar systems are exempt from property tax increases under California law.
These policies have helped push California’s installed solar capacity above 50,000 megawatts, leading the nation by a wide margin.
Sources & Methodology
This report draws from publicly available data published by the U.S. Energy Information Administration (EIA) and the Solar Energy Industries Association (SEIA). The analysis incorporates the most recent data available as of Q1 2025.
Electricity Reliability
To assess grid reliability across states and utility providers, we used 2023 data from Form EIA-861, which is released annually by the EIA. This dataset includes two core reliability metrics:
- SAIFI (System Average Interruption Frequency Index): Measures how often the average customer experiences a non-momentary power outage in a calendar year.
- SAIDI (System Average Interruption Duration Index): Measures the total duration of non-momentary outages experienced by the average customer over the same period.
Both metrics were analyzed at the state level and for individual utility providers in California. Because outage duration is reported in minutes, we converted all SAIDI values into hours to improve readability. Note: 2024 SAIFI and SAIDI data will not be available until October 2025; therefore, this report relies on 2023 figures—the latest year for which complete data exists.
Electricity Prices
We analyzed residential electricity prices by comparing statewide average prices per kilowatt hour (kWh) for February 2024 and February 2025, as reported by the EIA. These monthly averages were used to calculate the year-over-year percentage change in electricity pricing at the state level.
Solar Adoption
Solar generation data was sourced from the SEIA’s publicly released quarterly reports, current through Q4 2024. Three key solar adoption metrics were included:
- The percentage of each state’s electricity generated from solar
- Each state’s national ranking in total installed solar capacity (both for 2024 and 2025)
- The total number of megawatts (MW) of solar capacity installed by state
Together, these metrics provide a picture of how solar investment is growing across the U.S., with particular focus on the Southwest region.
In contrast, many Southern and Southeastern states, including Oklahoma, Tennessee, and Mississippi, continue to experience high downtime and low solar adoption. Most generate less than 5% of their electricity from solar and exceed the national average in outage hours.